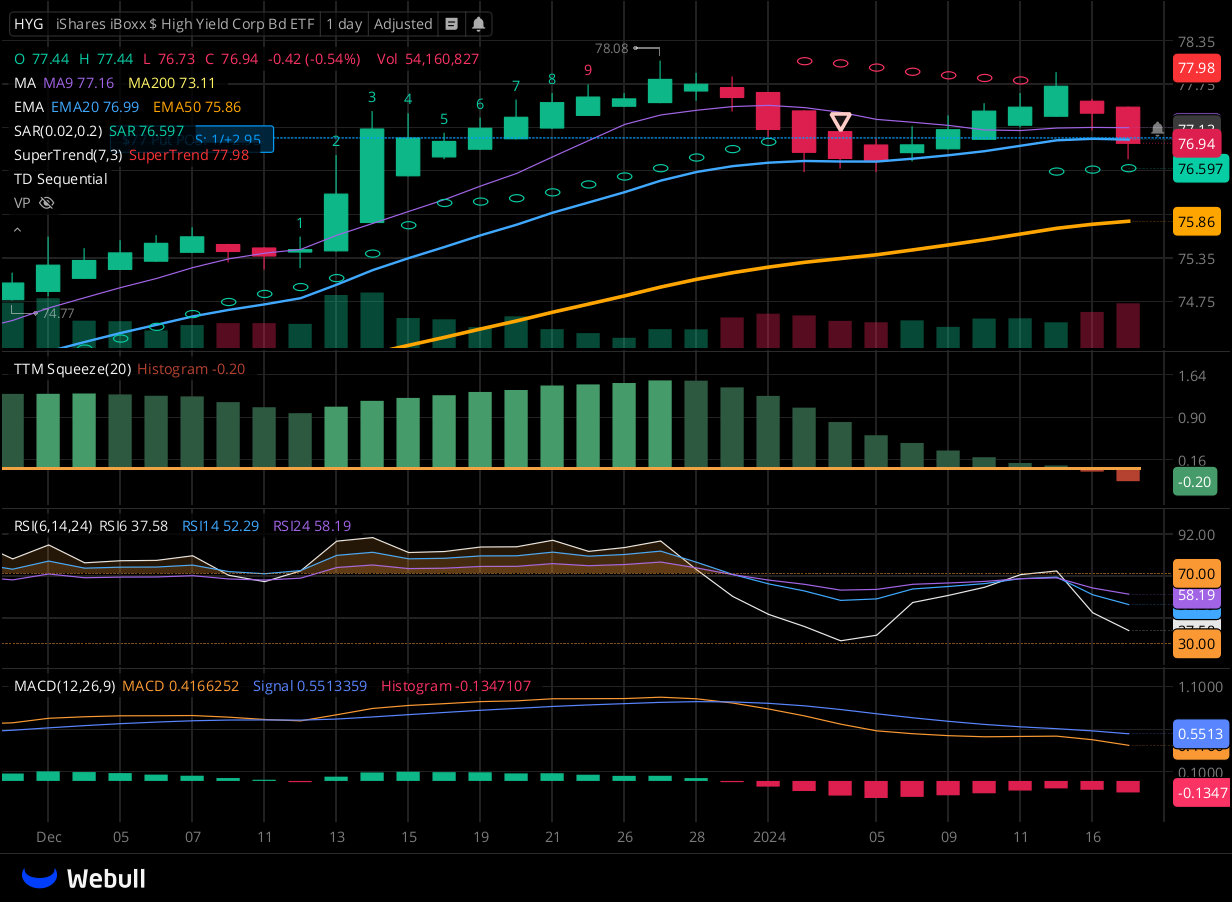
CTA for HYG as of 2024-01-17

MTP for HYG as of 2024-01-17

Chart for HYG as of 2024-01-17

No activity on the CTA report, but a first sell signal on the MTP report with a full candle below the 9SMA makes the start of a bearish case. From looking at the RSI and MACD divergence with the max buy signal on the longer timeframes of the MTP report, could we be at the start of a downtrend?
Bought a PUT at open to see where that leads.