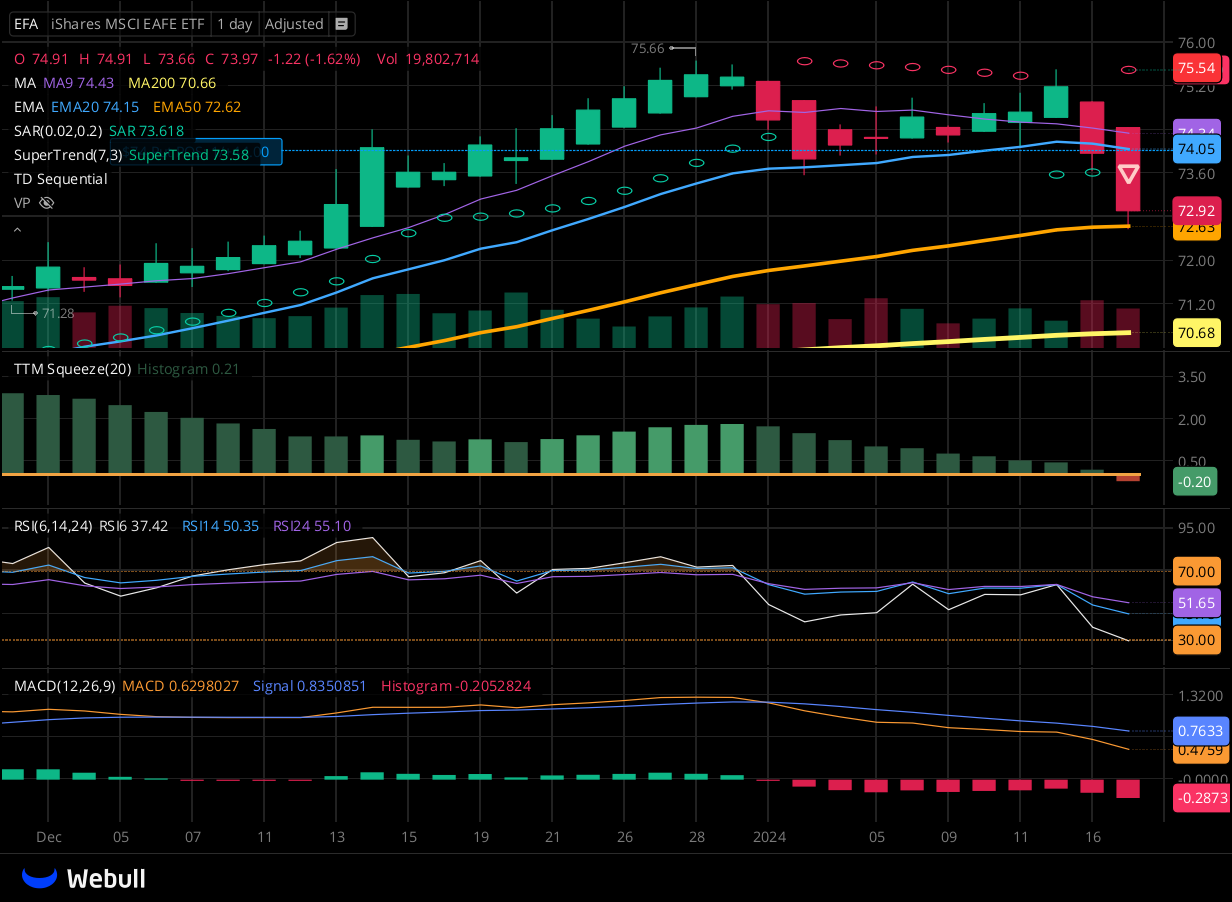
CTA for EFA as of 2024-01-16

CTA for EFA as of 2024-01-17

MTP for EFA as of 2024-01-17

Chart for EFA as of 2024-01-17

It looks the CTA report suggests positions might be coming off their longs at the same time the MTP report got it's first sell signal. With max buy signals on the longer timeframes, could we be looking at the start of a correction?
Had bought a PUT at open on the 16th to see where that leads.